Data story
about this project
This was my pre-thesis project at IIT Bombay. It shows the process of coming up with an interactive data story to improve the public understanding fo scientific concepts like the theory of evolution. Below, the process is outlined along with some snippets from the final outcome.
introduction
Overview
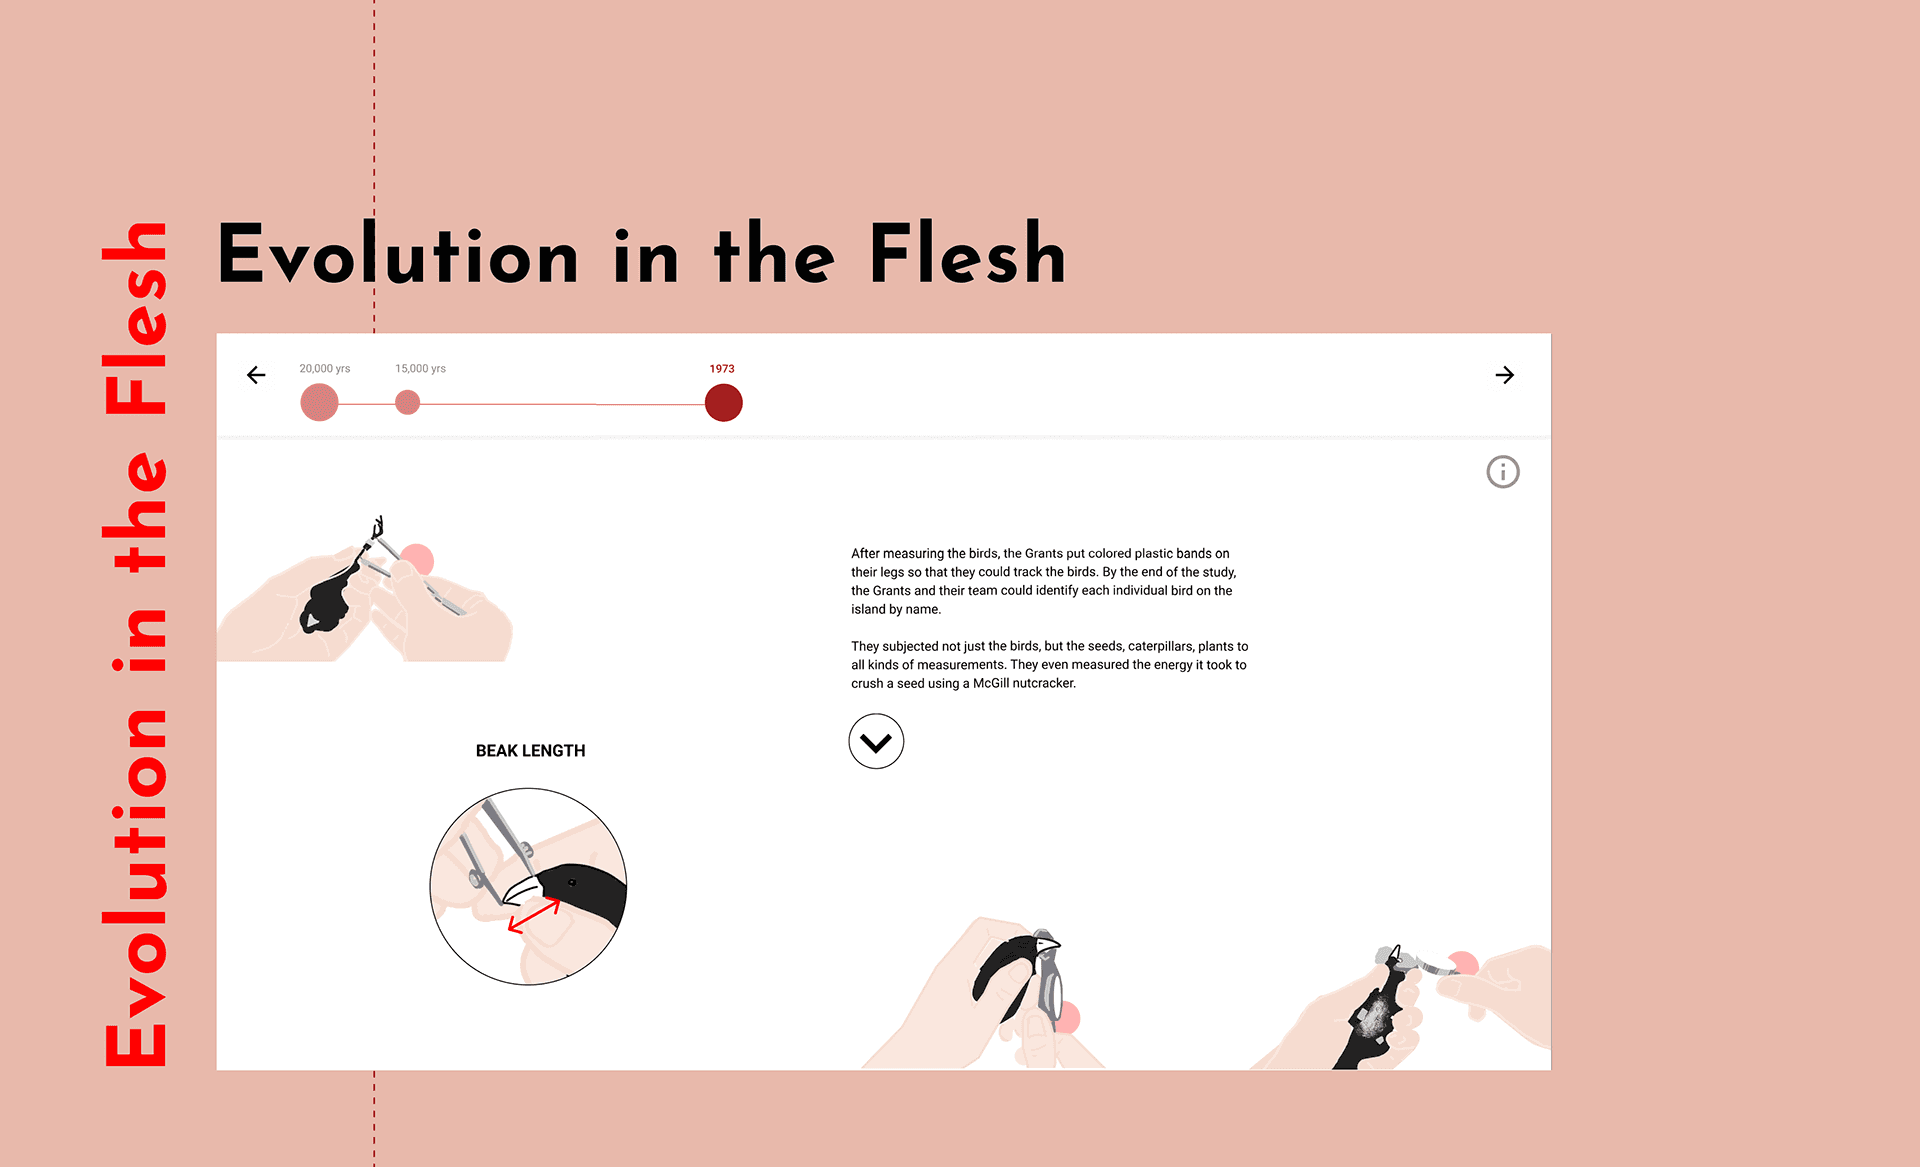
This interactive data story explains the concept of evolution through the lens of a 40-year field study conducted by Peter and Rosemary Grant on Daphne Major in the Galápagos. Over time, they observed changes in finch populations in response to shifts in climate, food sources, and competition. This project aims to translate their findings into a visual, intuitive experience for a general audience.
I created this as part of my pre-thesis project during my Master's in Interaction Design at IDC, IIT Bombay. It sits at the intersection of science communication, information design, and storytelling with data.
Process
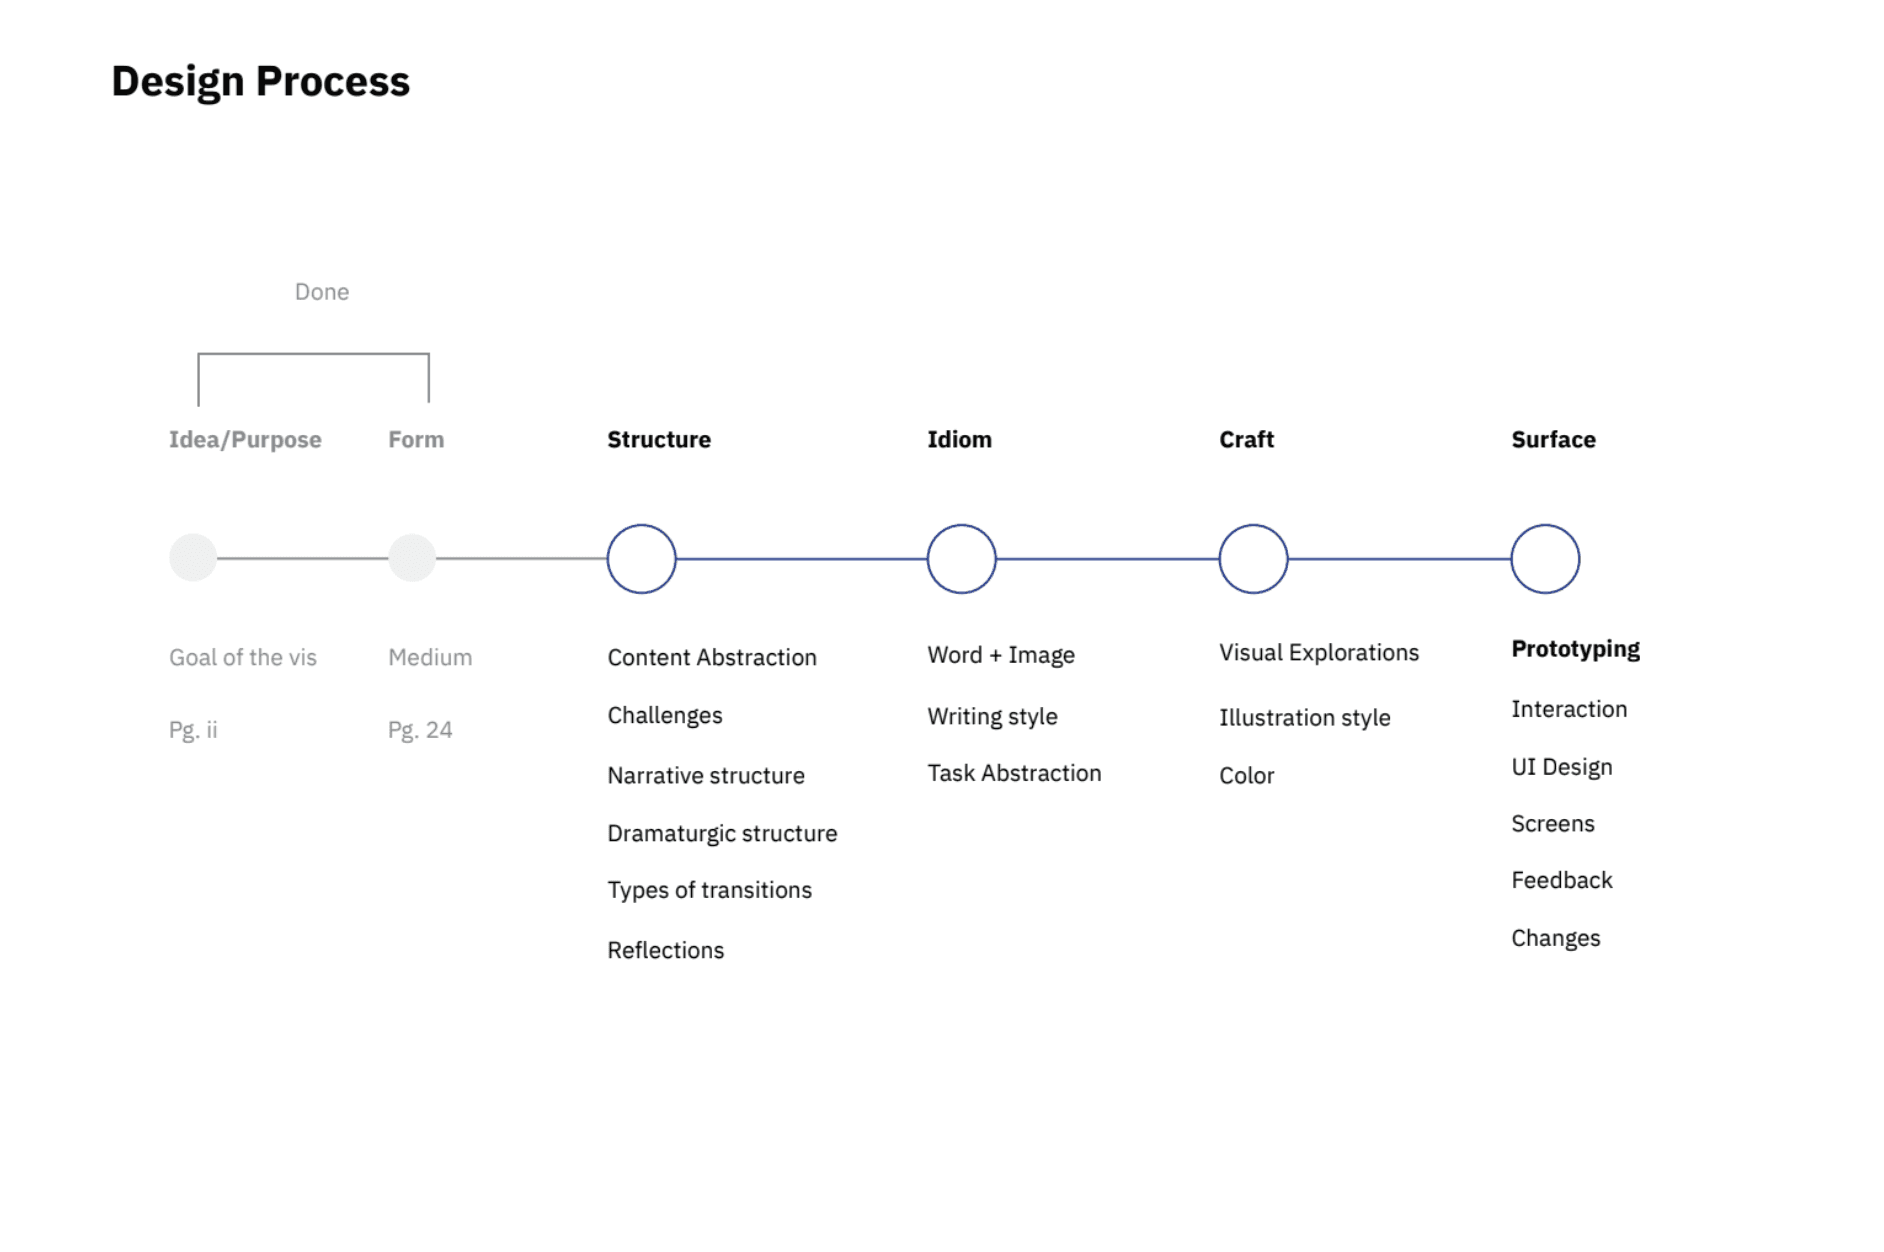
Process & Craft
Understanding the domain
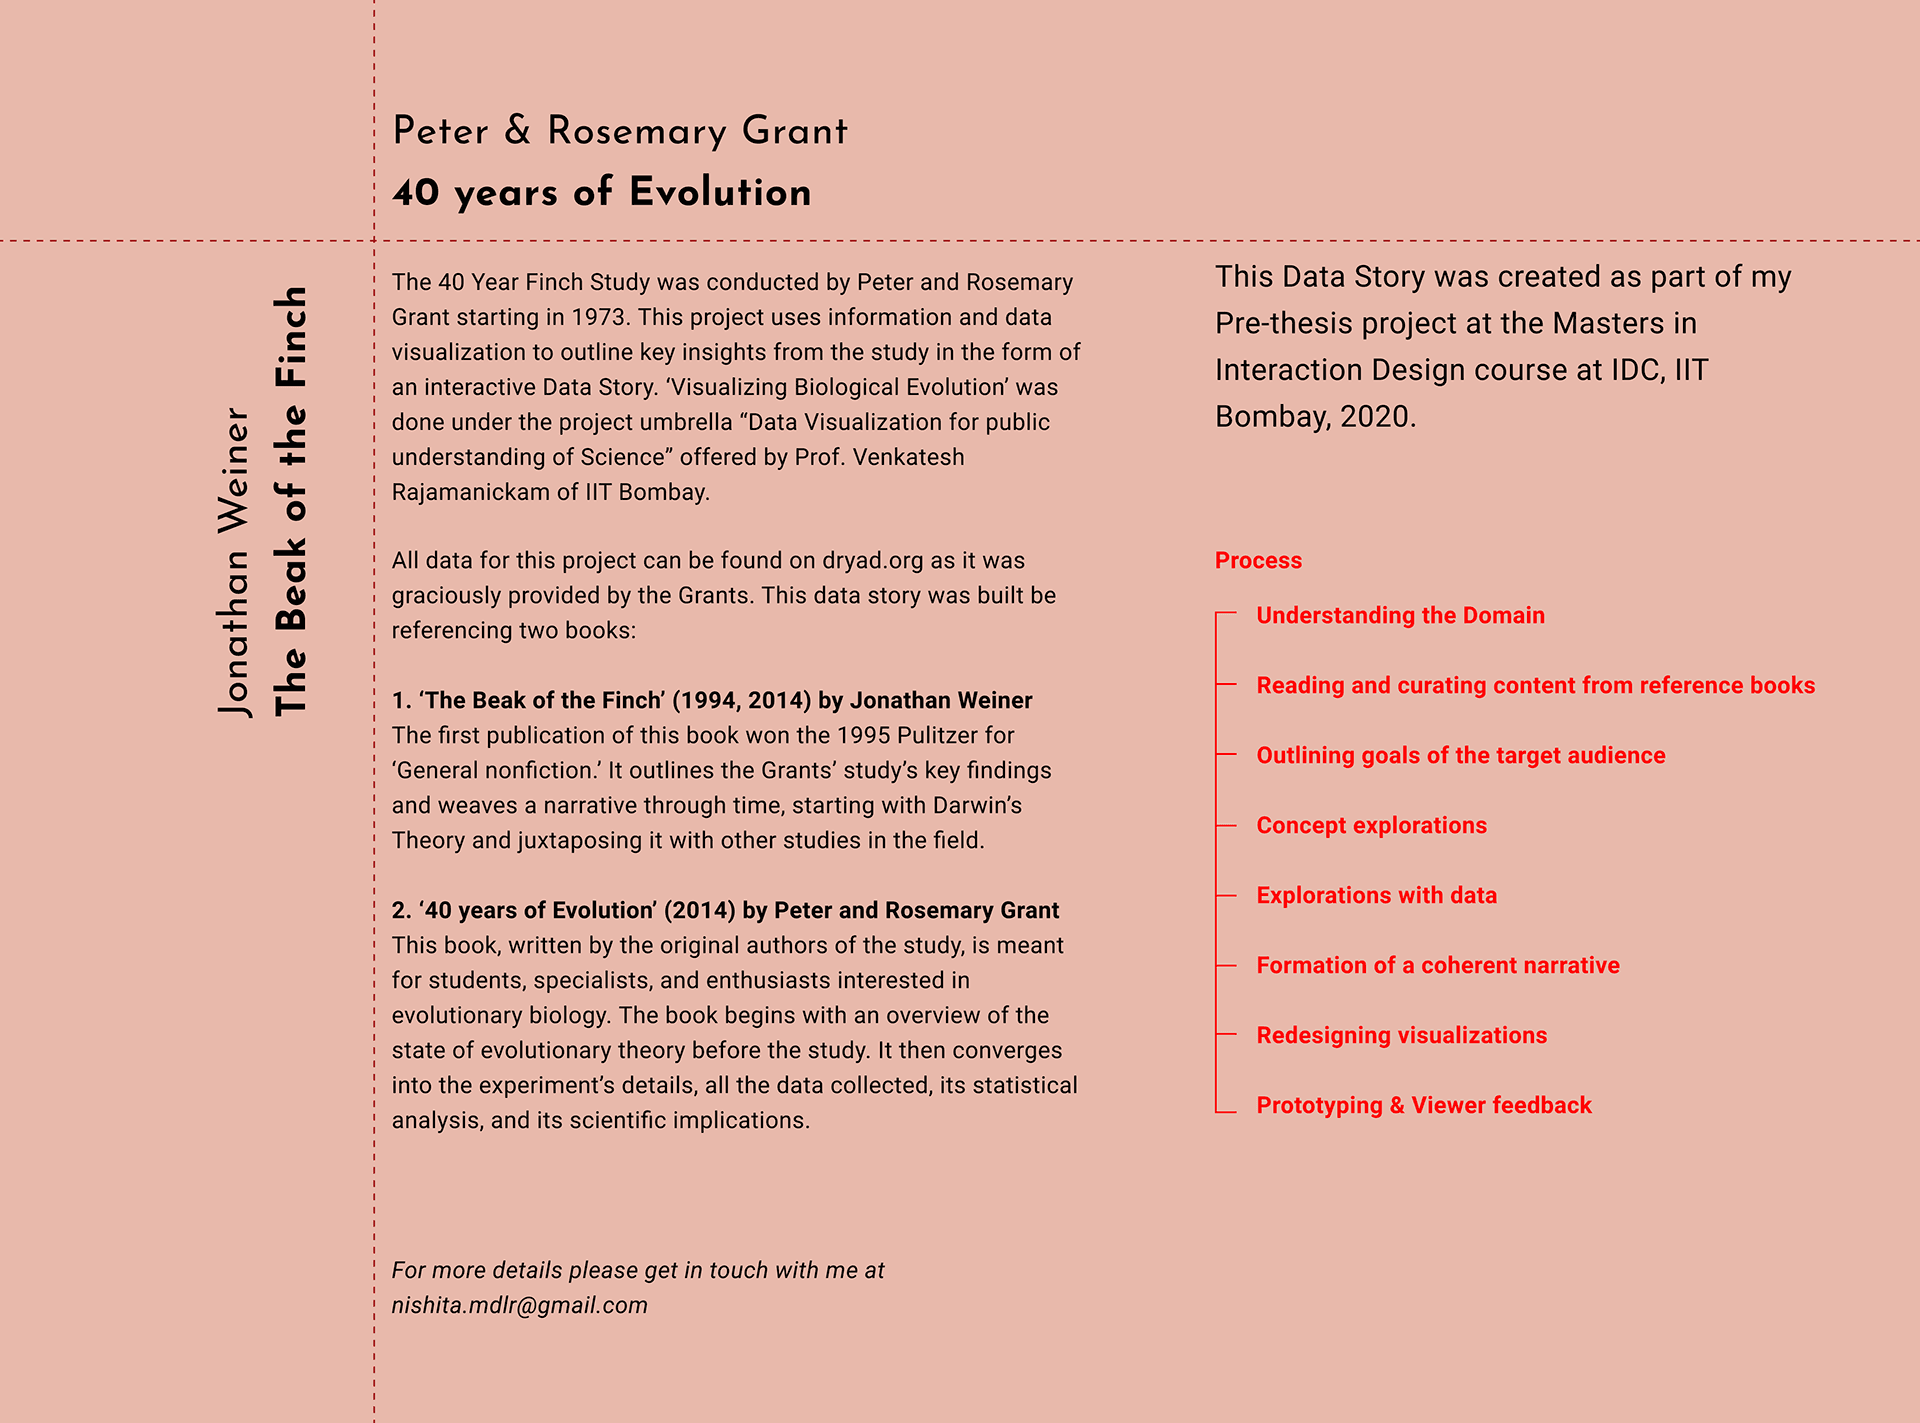
I began by diving into two books — The Beak of the Finch by Jonathan Weiner, and 40 Years of Evolution by the Grants themselves. These not only provided content but also helped frame the narrative tone and key moments.
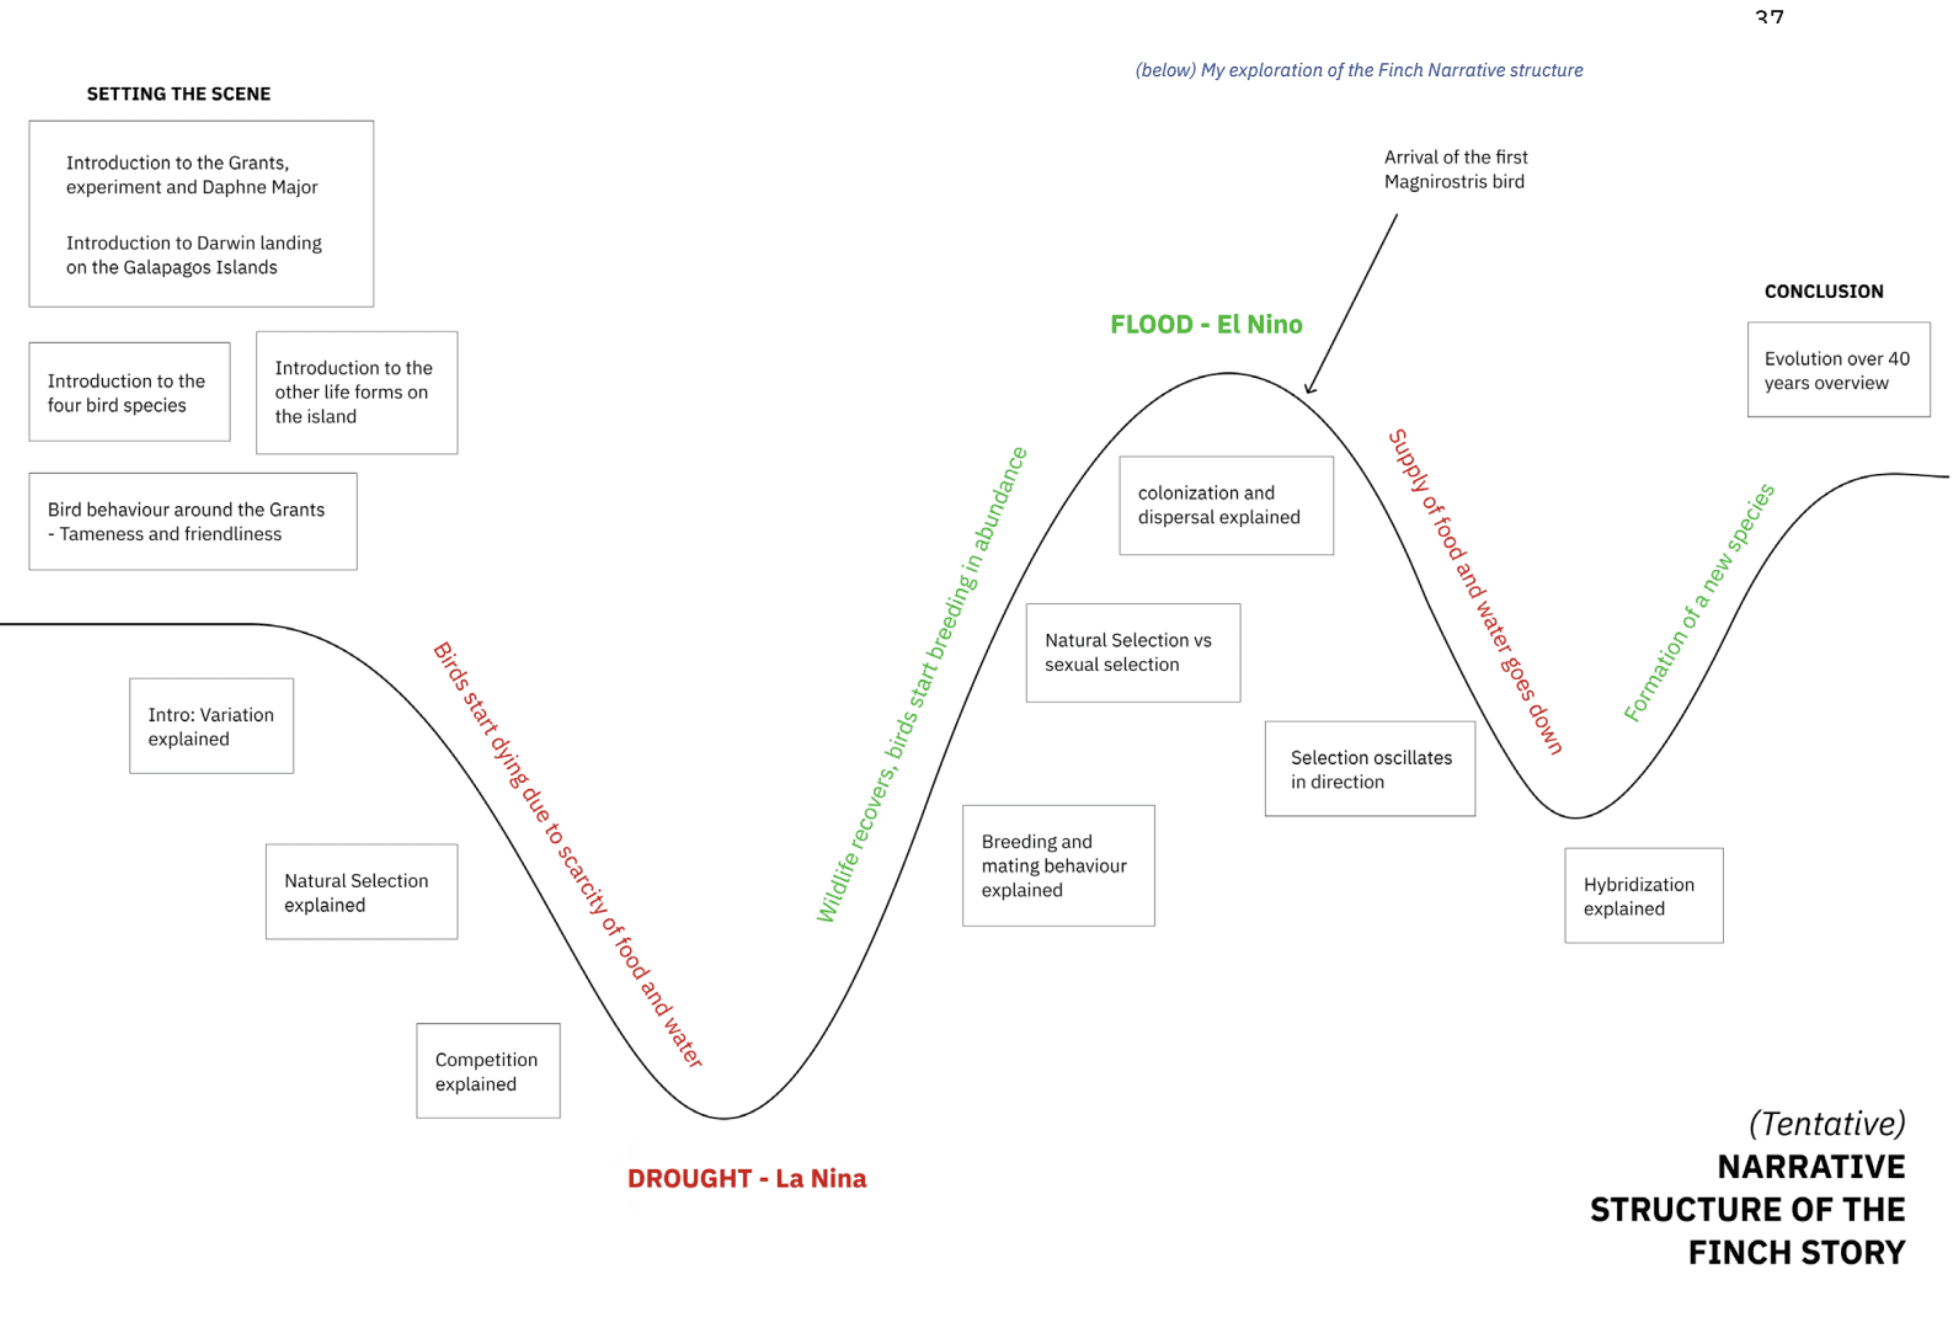
Framing the story
I broke the story into a sequence that would feel natural to someone encountering these ideas for the first time. Using ideas from Scott McCloud’s storytelling through visuals, I shaped a flow that moved from geography and isolation to adaptation and selection.
Working with data
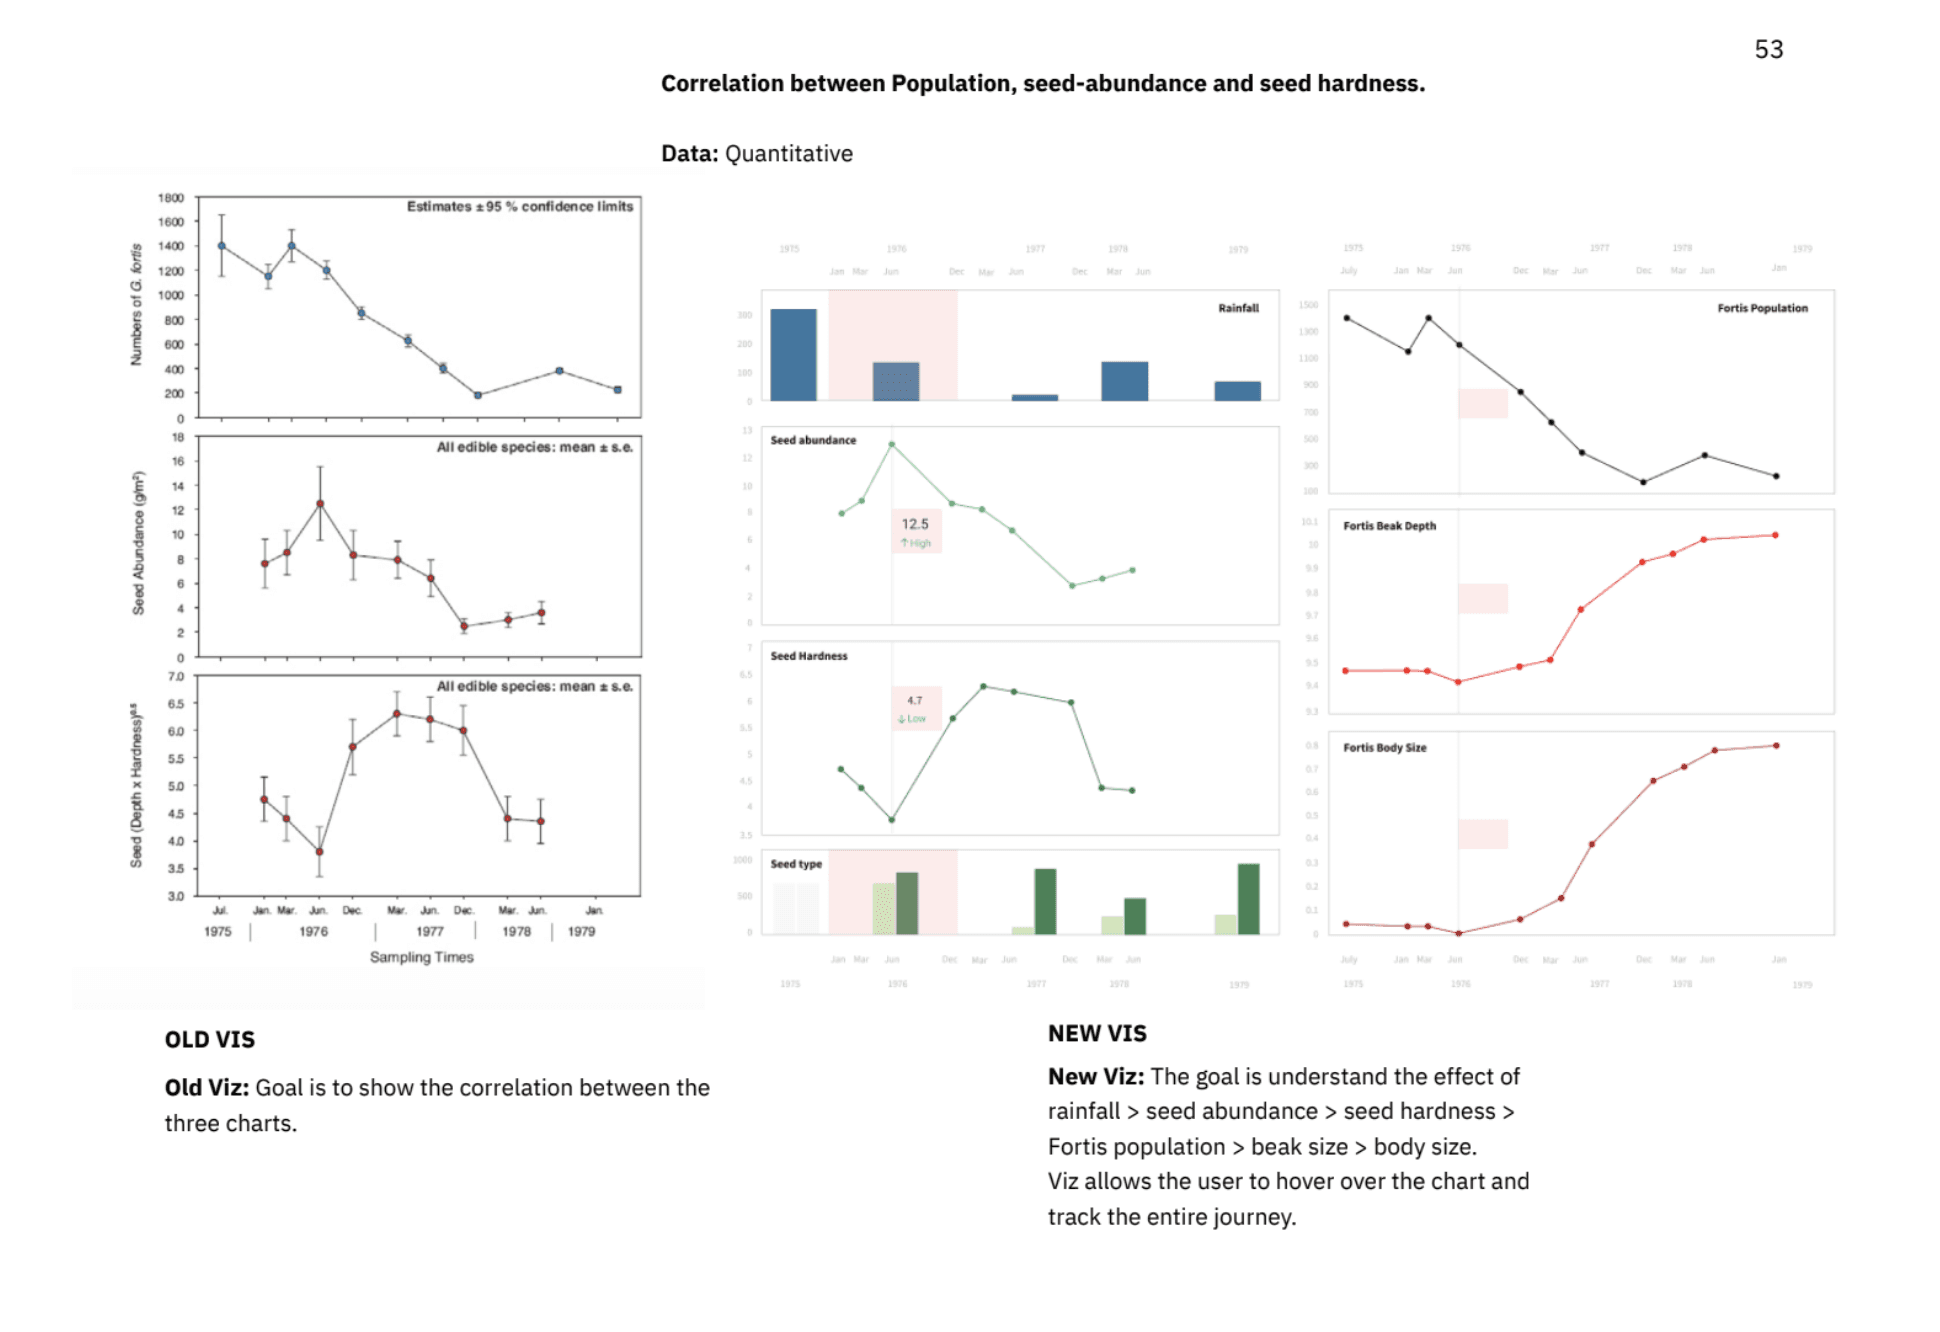
I used real-world data made available by the Grants through Dryad.org. With help from research like Tamara Munzner’s Visualization Analysis and Design and insights from the Reflections on how designers design with data paper, I explored different ways of presenting patterns over time without overwhelming the viewer.
Designing the experience
I kept the visual style simple and quiet, letting the story do the talking. Visual elements followed principles from Beautiful Evidence and Visual Grammar, while the pacing and interactivity took cues from projects like The Room of Change and Preservation of Favored Traces. I wanted each screen to feel like a page in a book you can move through at your own pace.
Prototyping and feedback
I shared early versions with classmates, science enthusiasts, and teachers. Their feedback helped simplify the language, fix navigation friction, and fine-tune the visuals. Some suggestions even changed how I approached the ending.
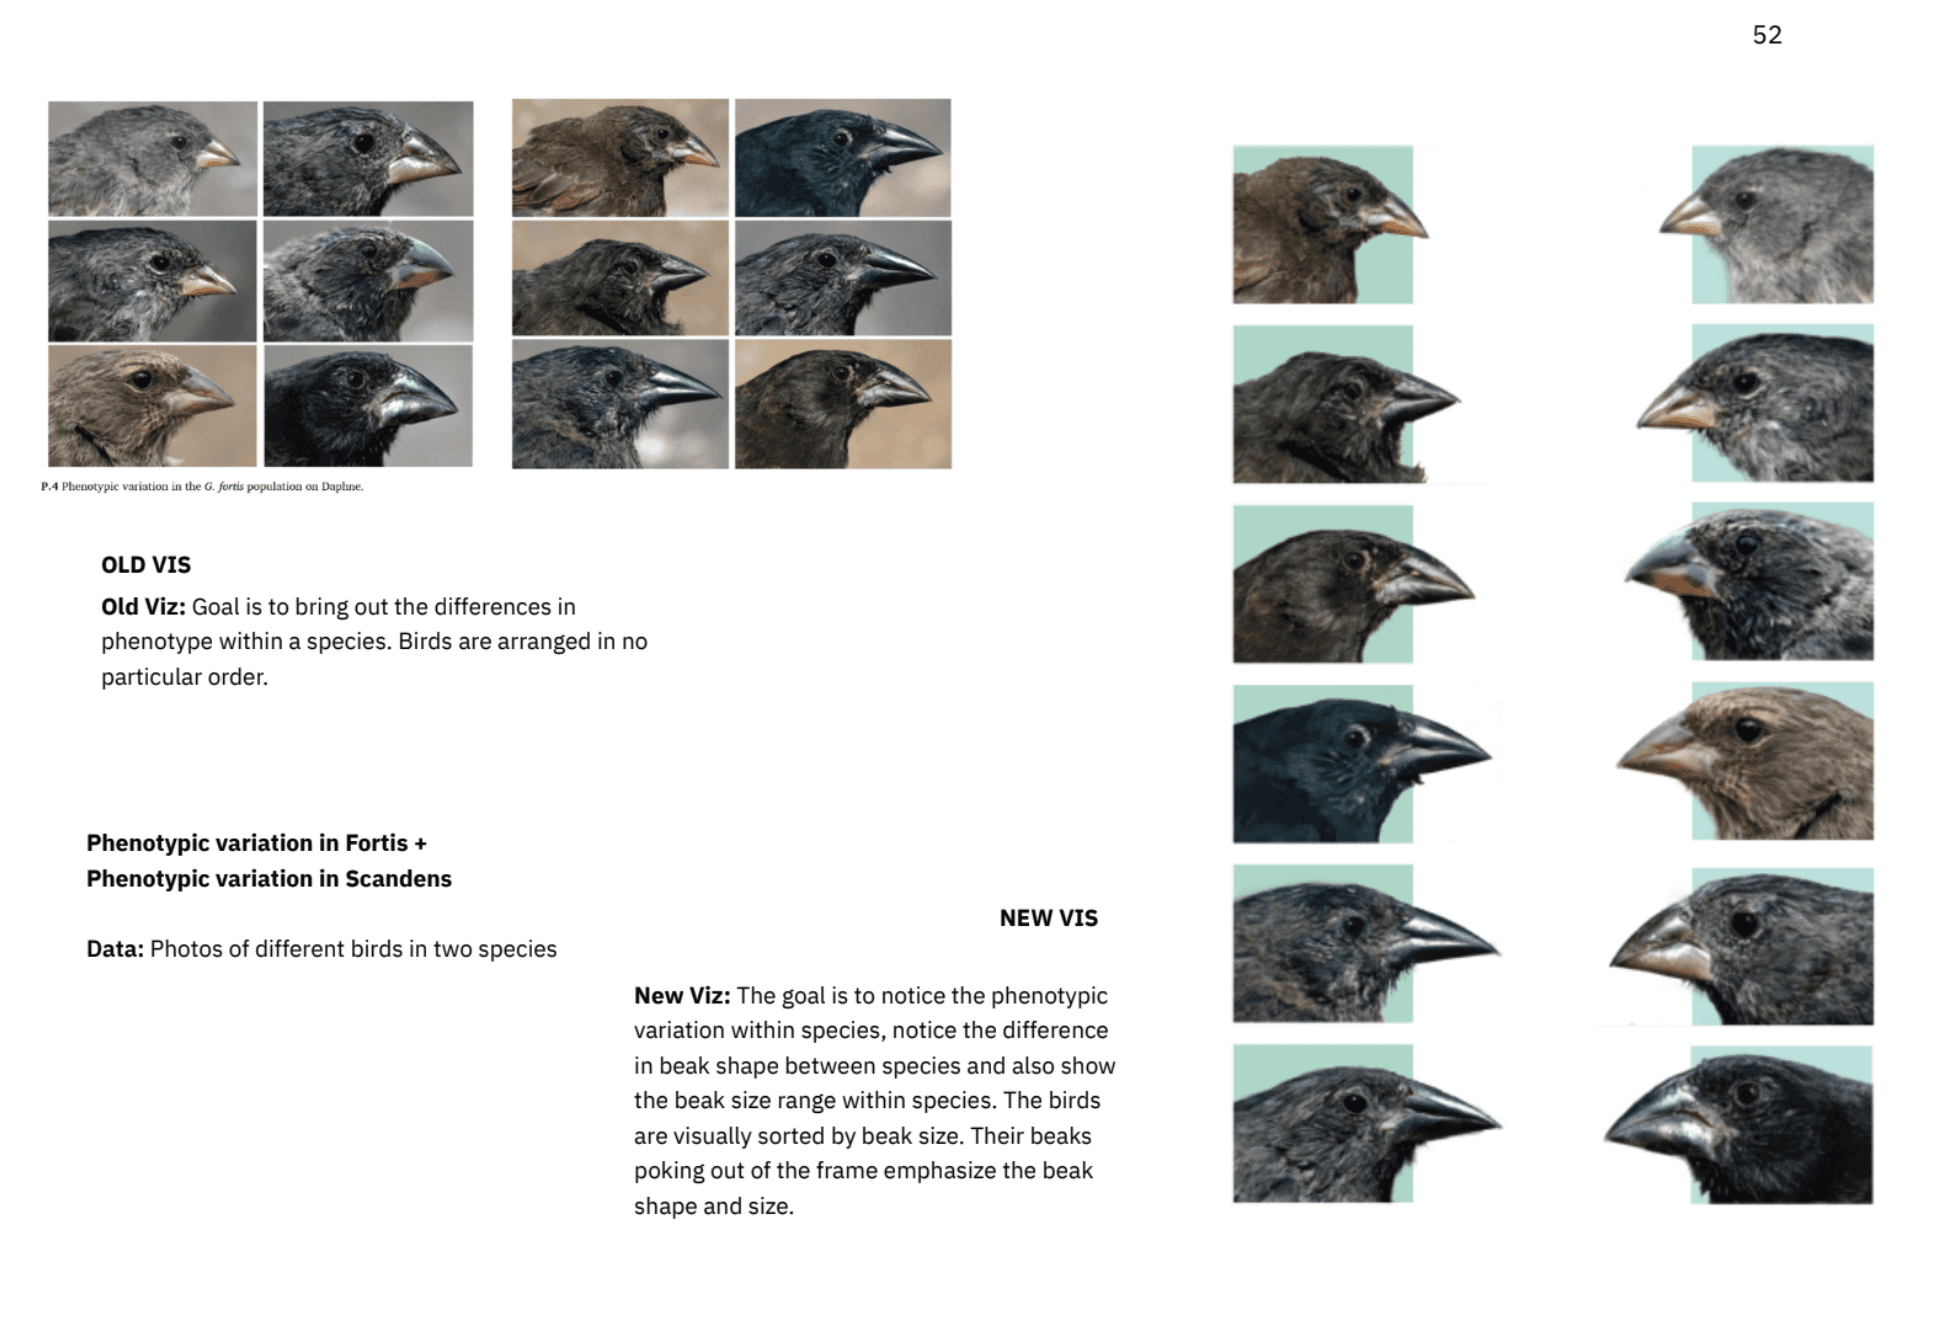
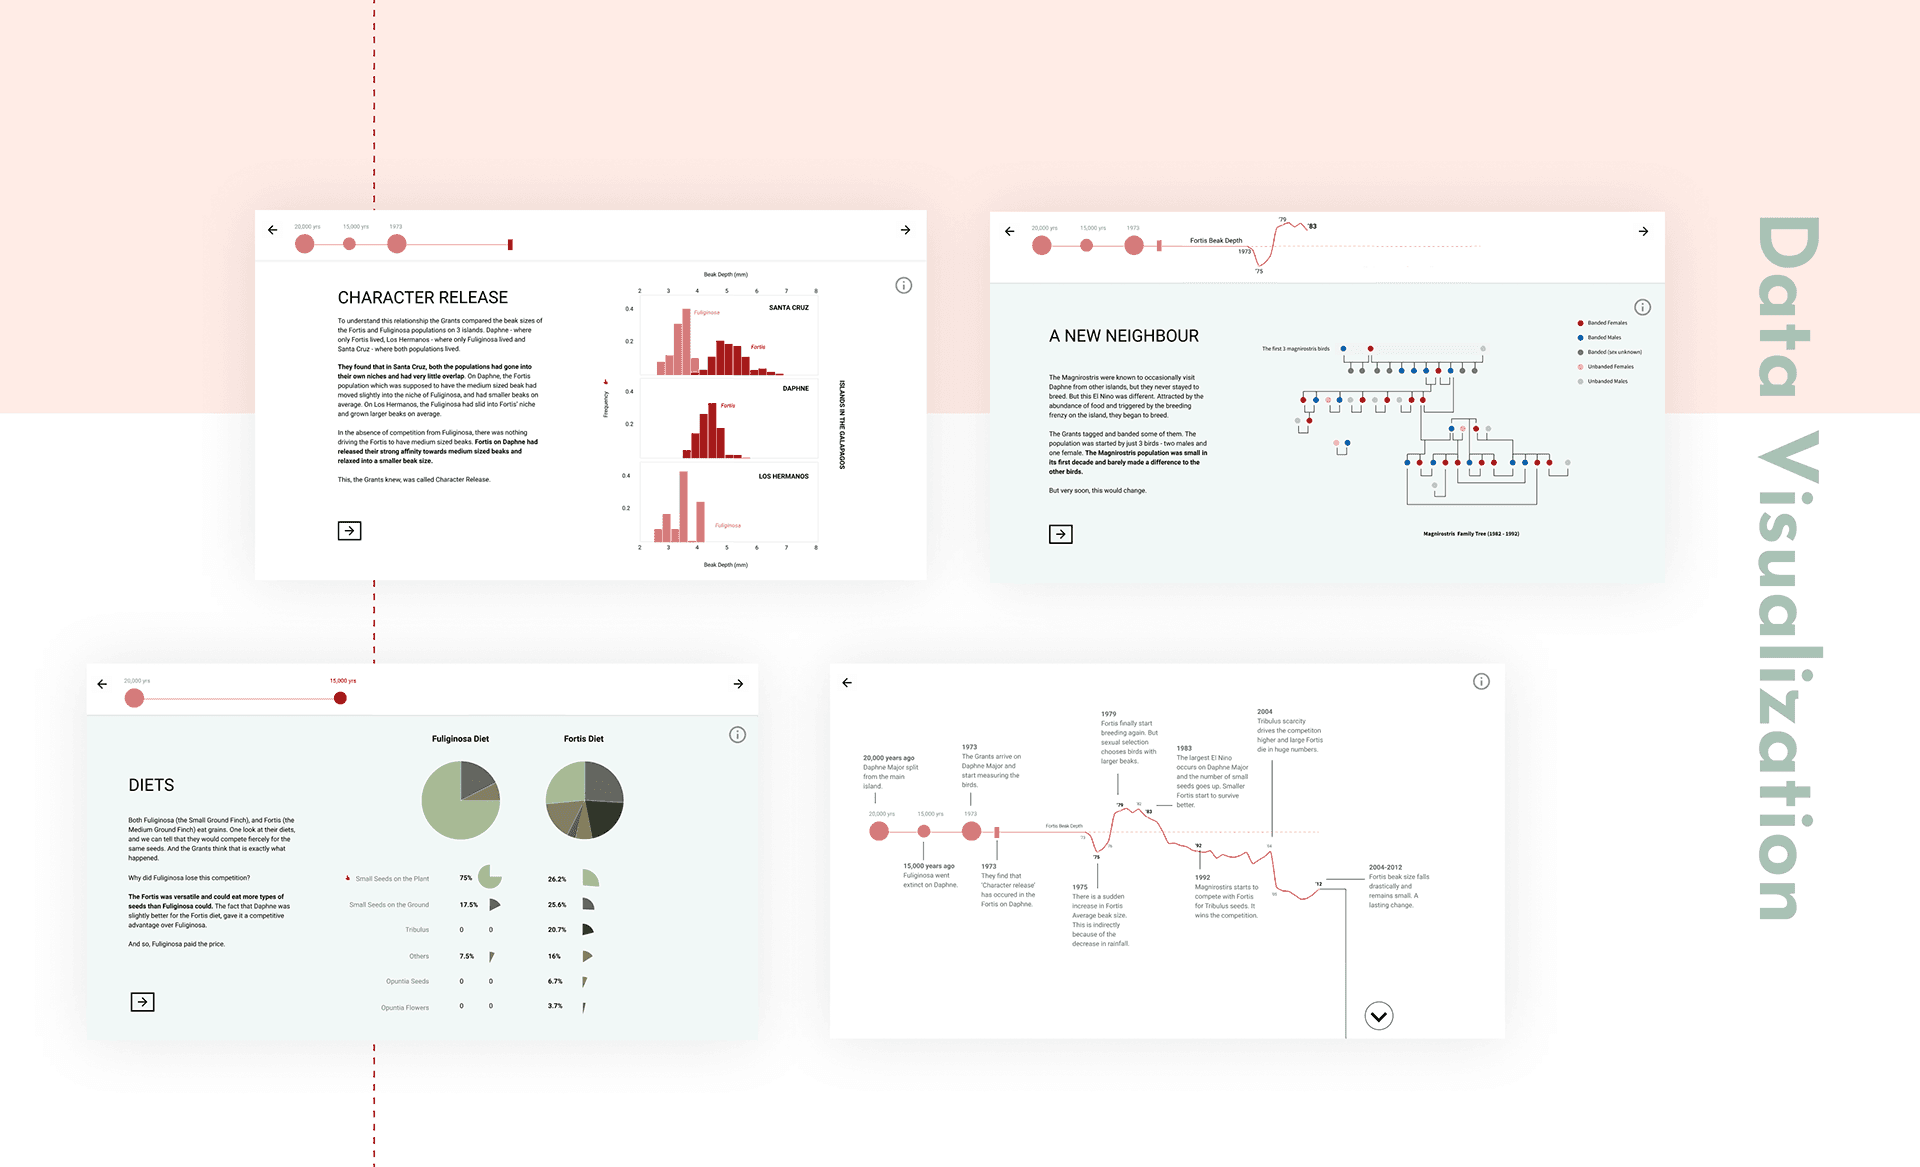
some examples of redesigned visualisations
final outcome
The final piece is an interactive web-page that walks users through how evolution unfolds — not as a fixed theory, but as a living process you can trace. It combines narrative, data, and visual storytelling to make ideas like competition, adaptation, and species change feel more tangible.
There’s a lot more detail on the data, research, and design thinking behind this project in the full report I’ve linked above.
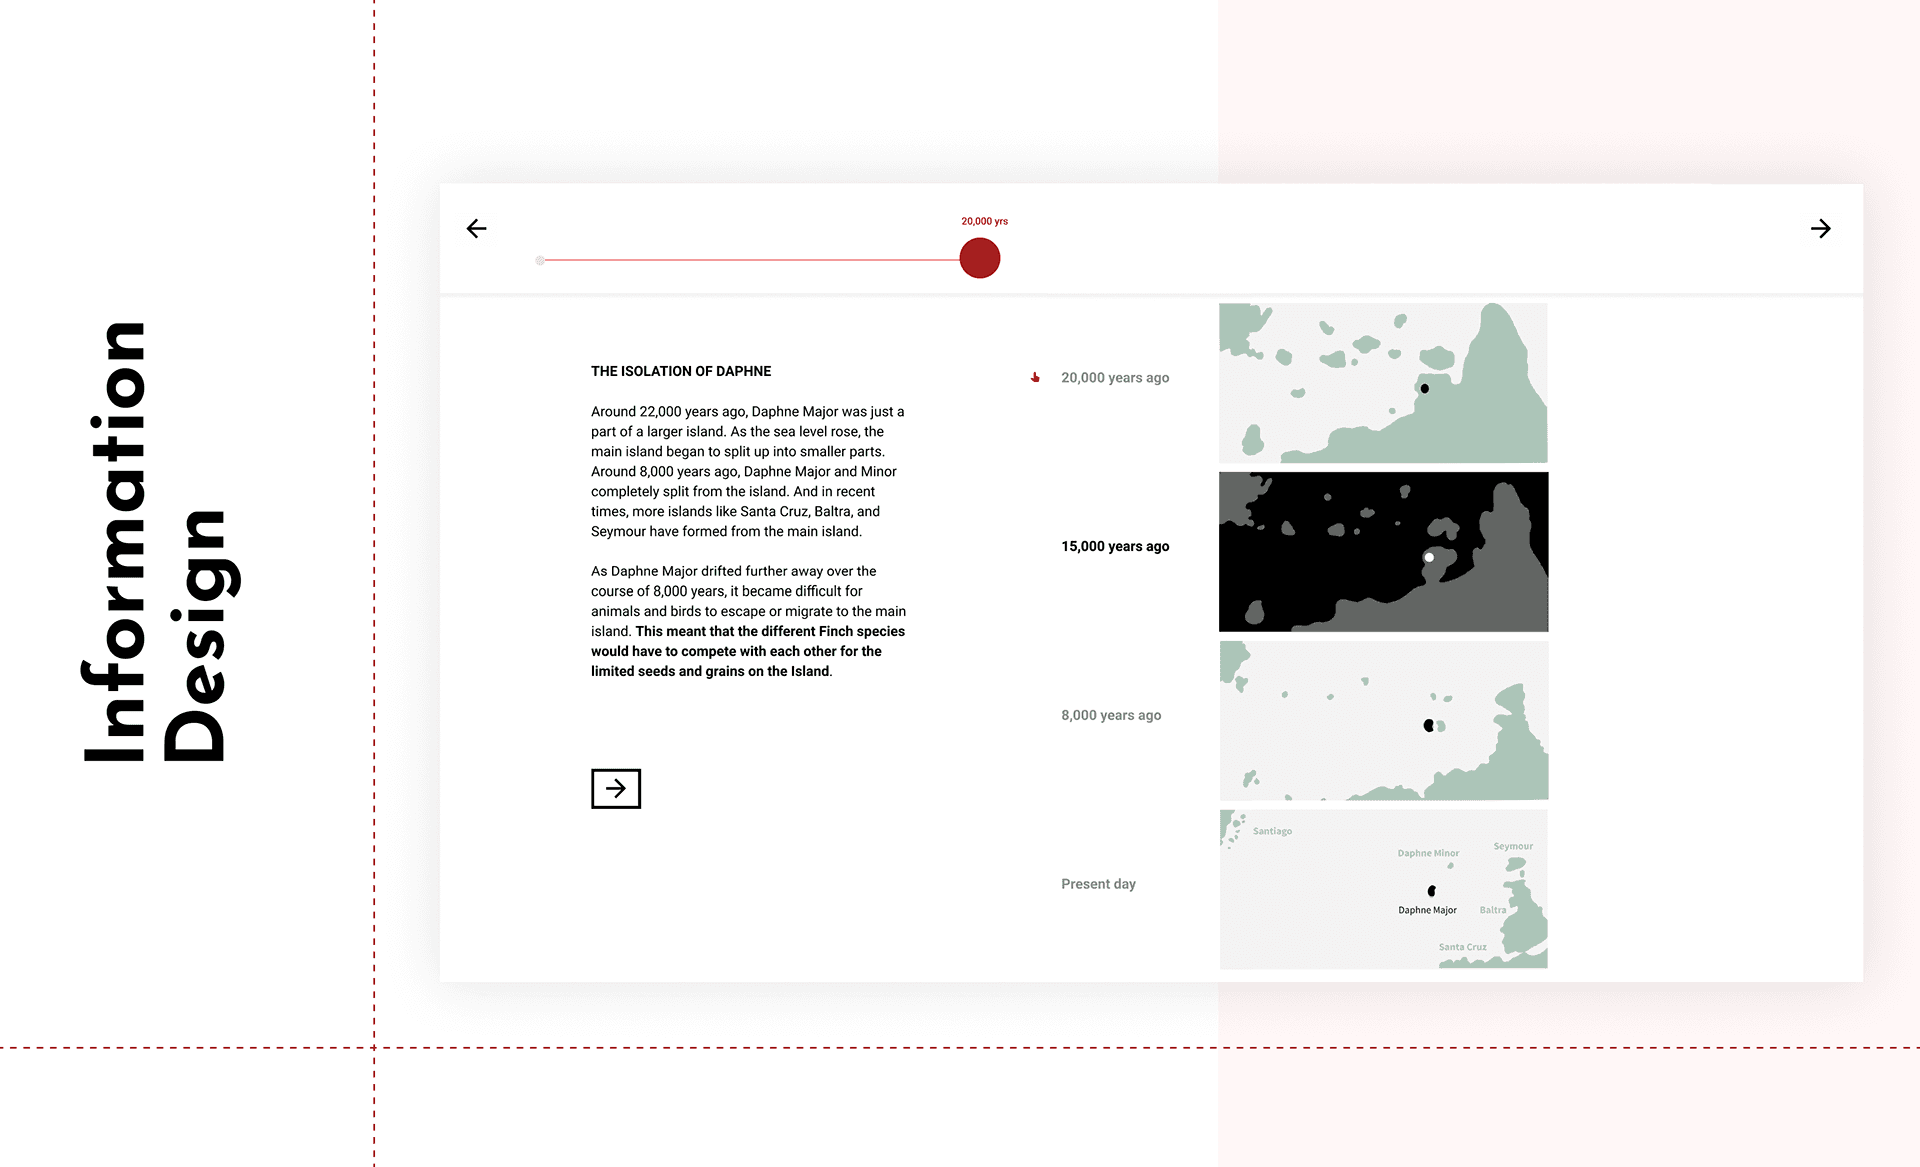
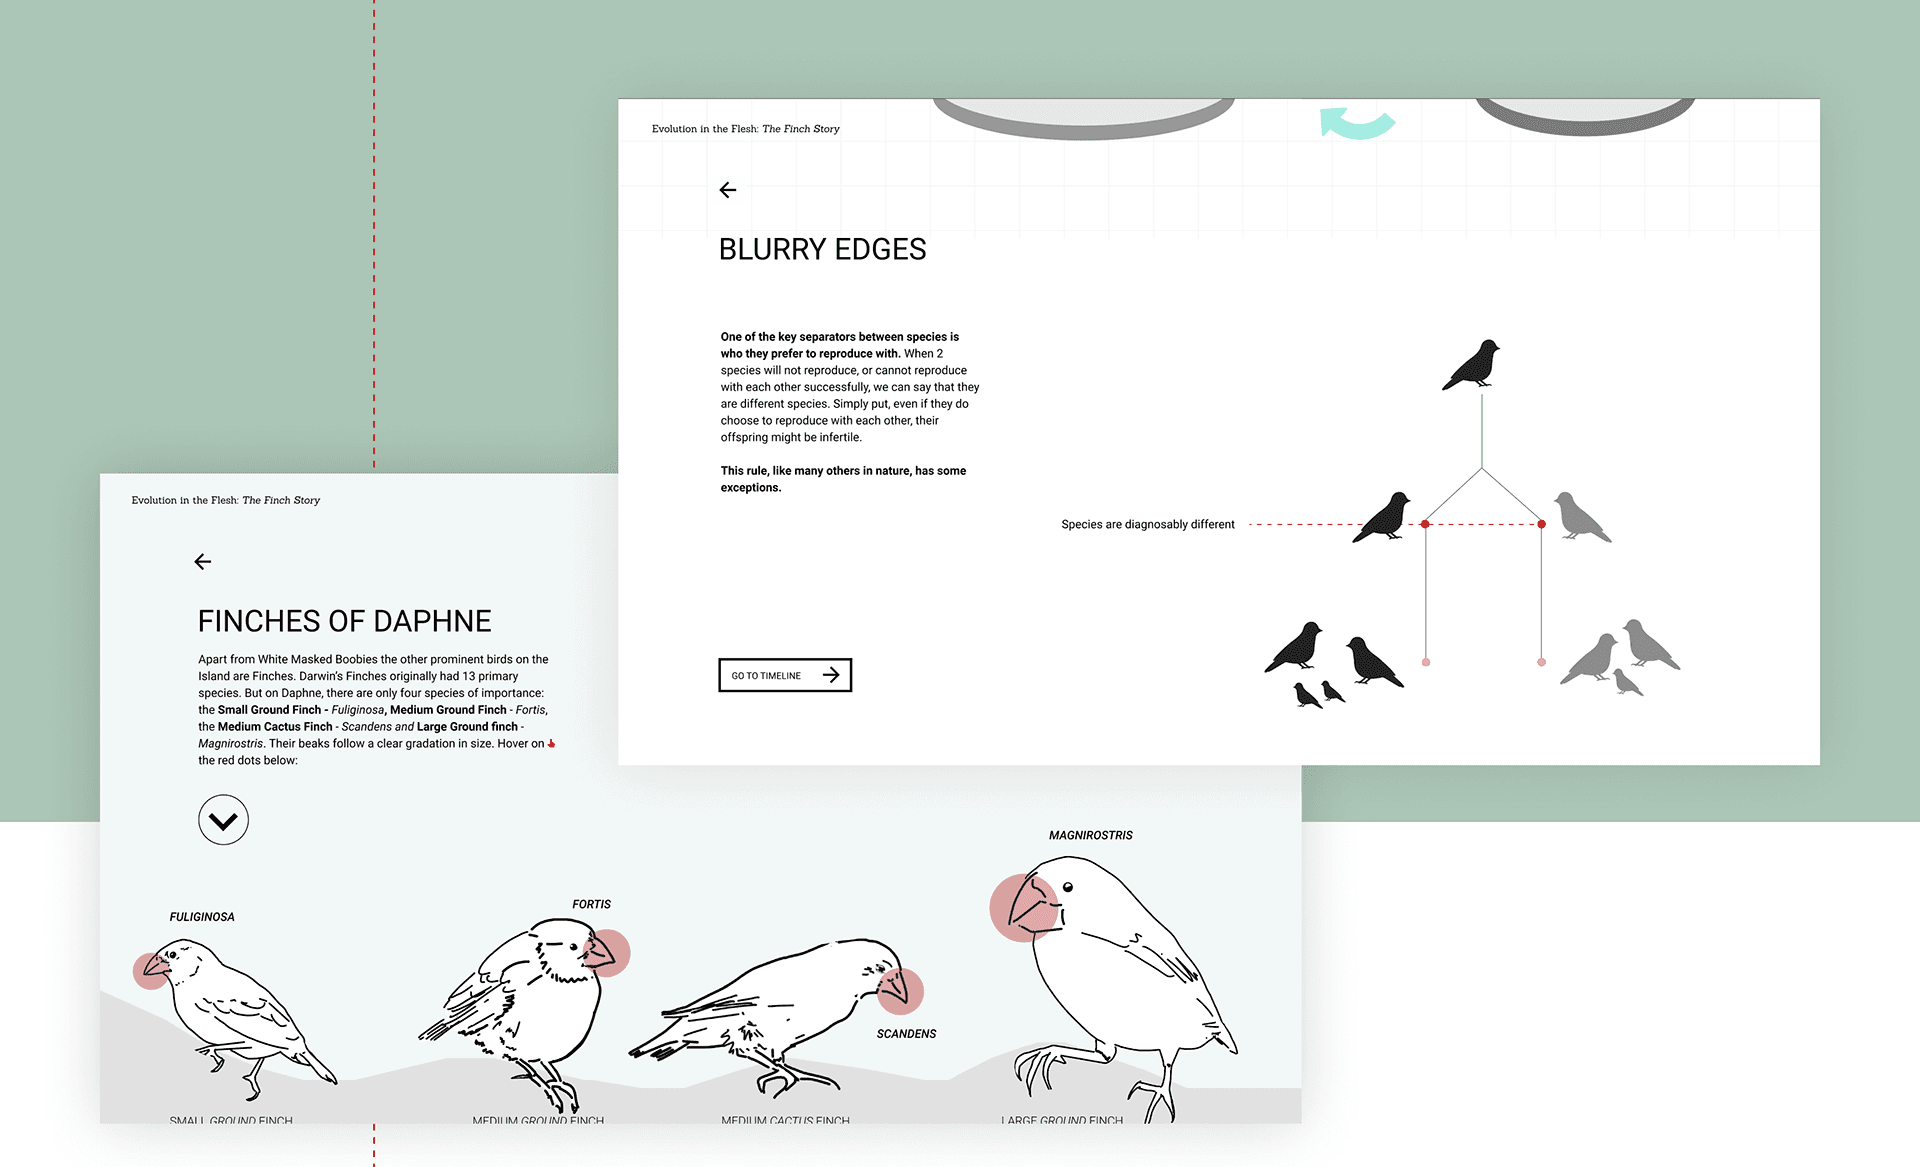
snippets from the web page
References
Jonathan Weiner. The Beak of the Finch
Peter & Rosemary Grant. 40 Years of Evolution
Scott Berinato. Visualizations That Really Work (Harvard Business Review)
Tamara Munzner. Visualization Analysis and Design
Alberto Cairo. How Charts Lie
Maire-Laure Ryan. Avatars of Story
Edward Tufte. Beautiful Evidence
Christian Leborg. Visual Grammar
Giorgia Lupi. The Room of Change
Fathom Studio. Preservation of Favored Traces
Bigelow, Druckery, Fishery, Meyer. Reflections on how designers design with data