Data visualisation
Pune City:
A schematic map
Pune City:
A schematic map
ROLE
Data Designer
EXPERTISE
Map design
YEAR
2020
about this project
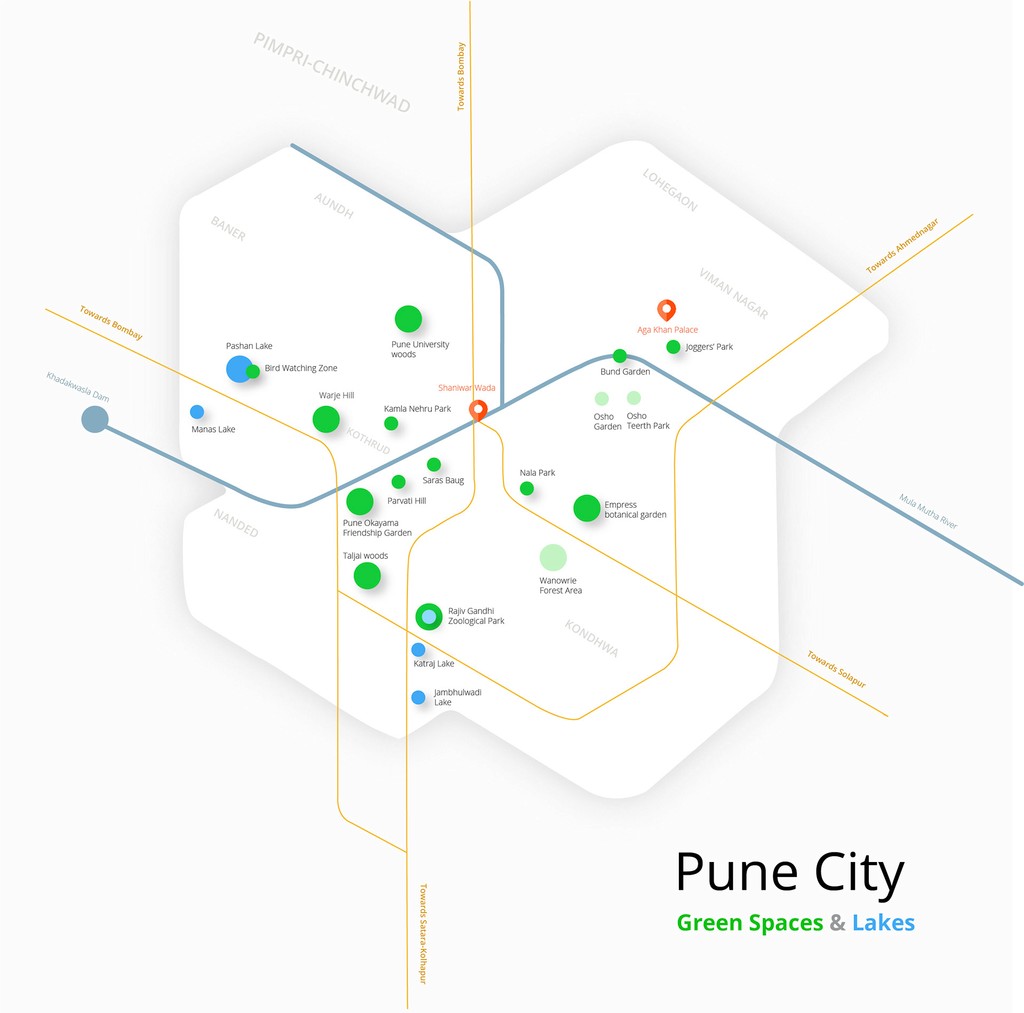
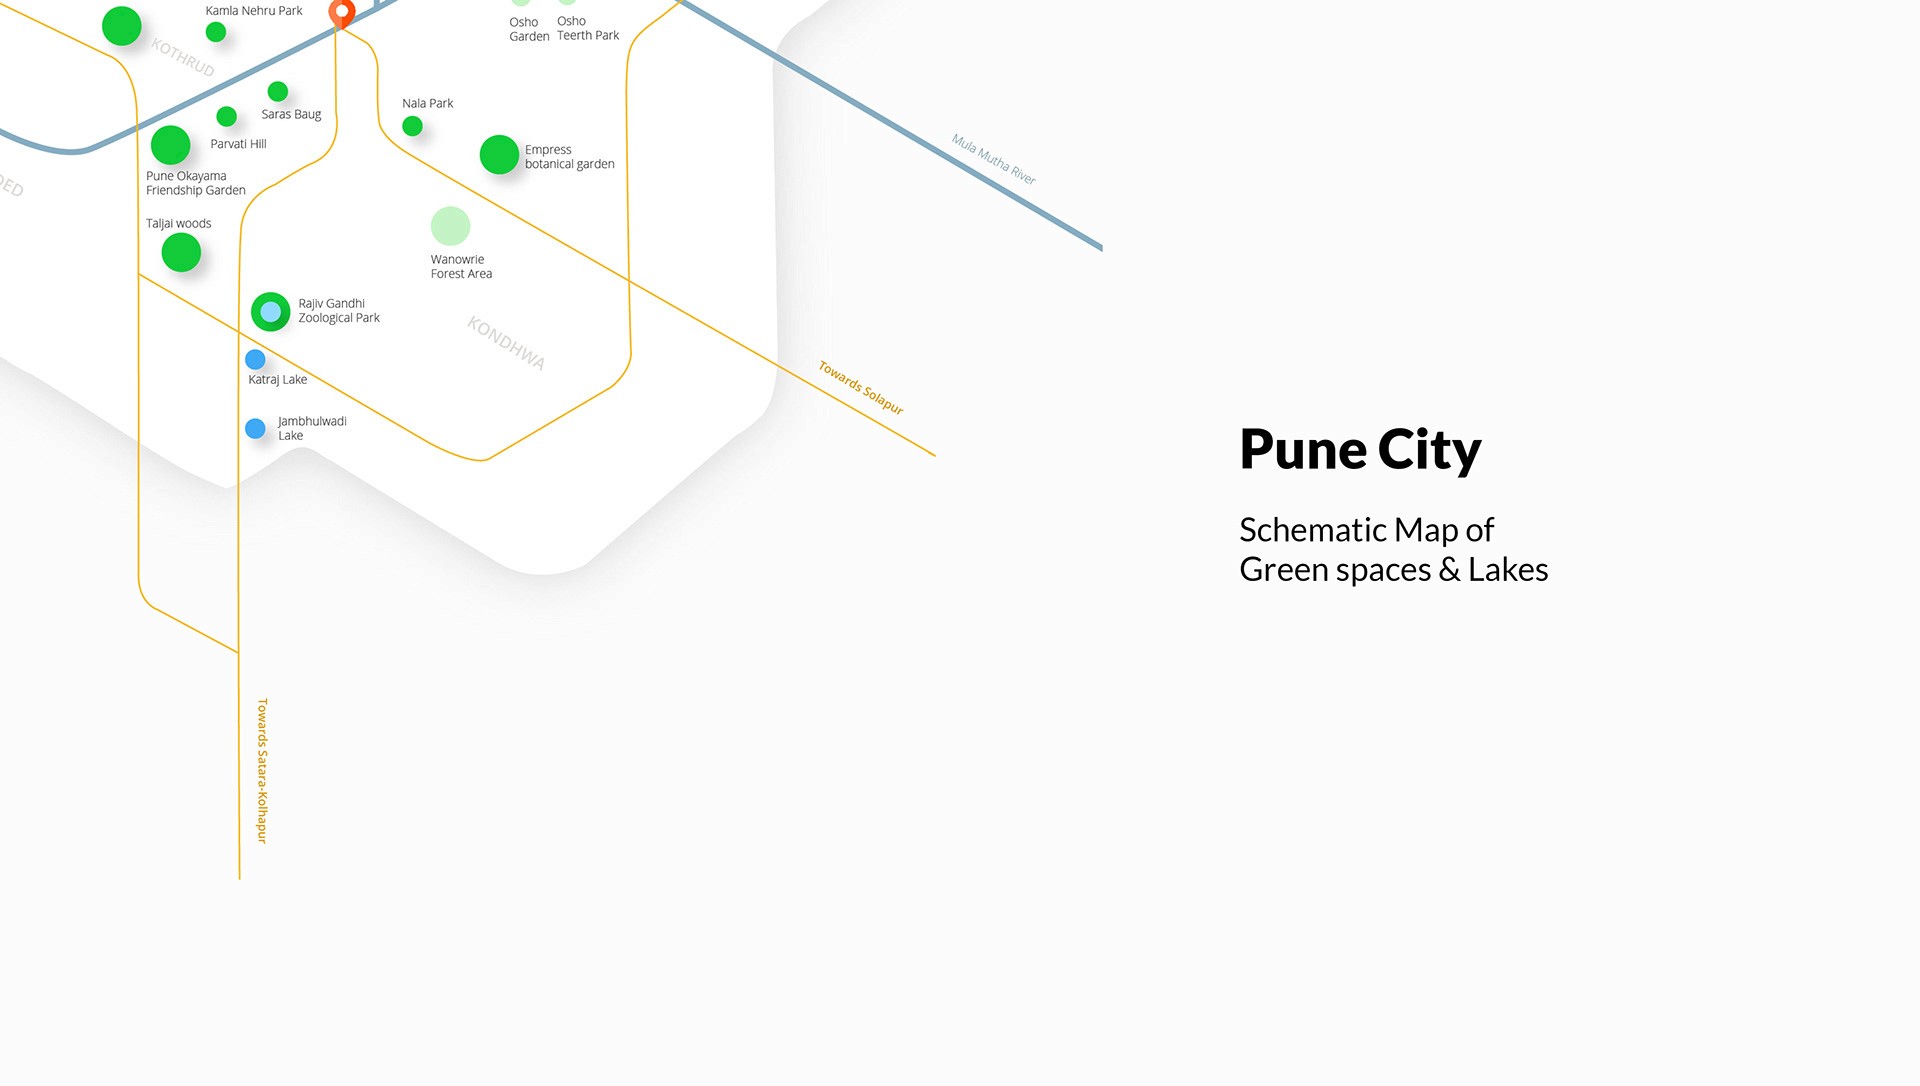
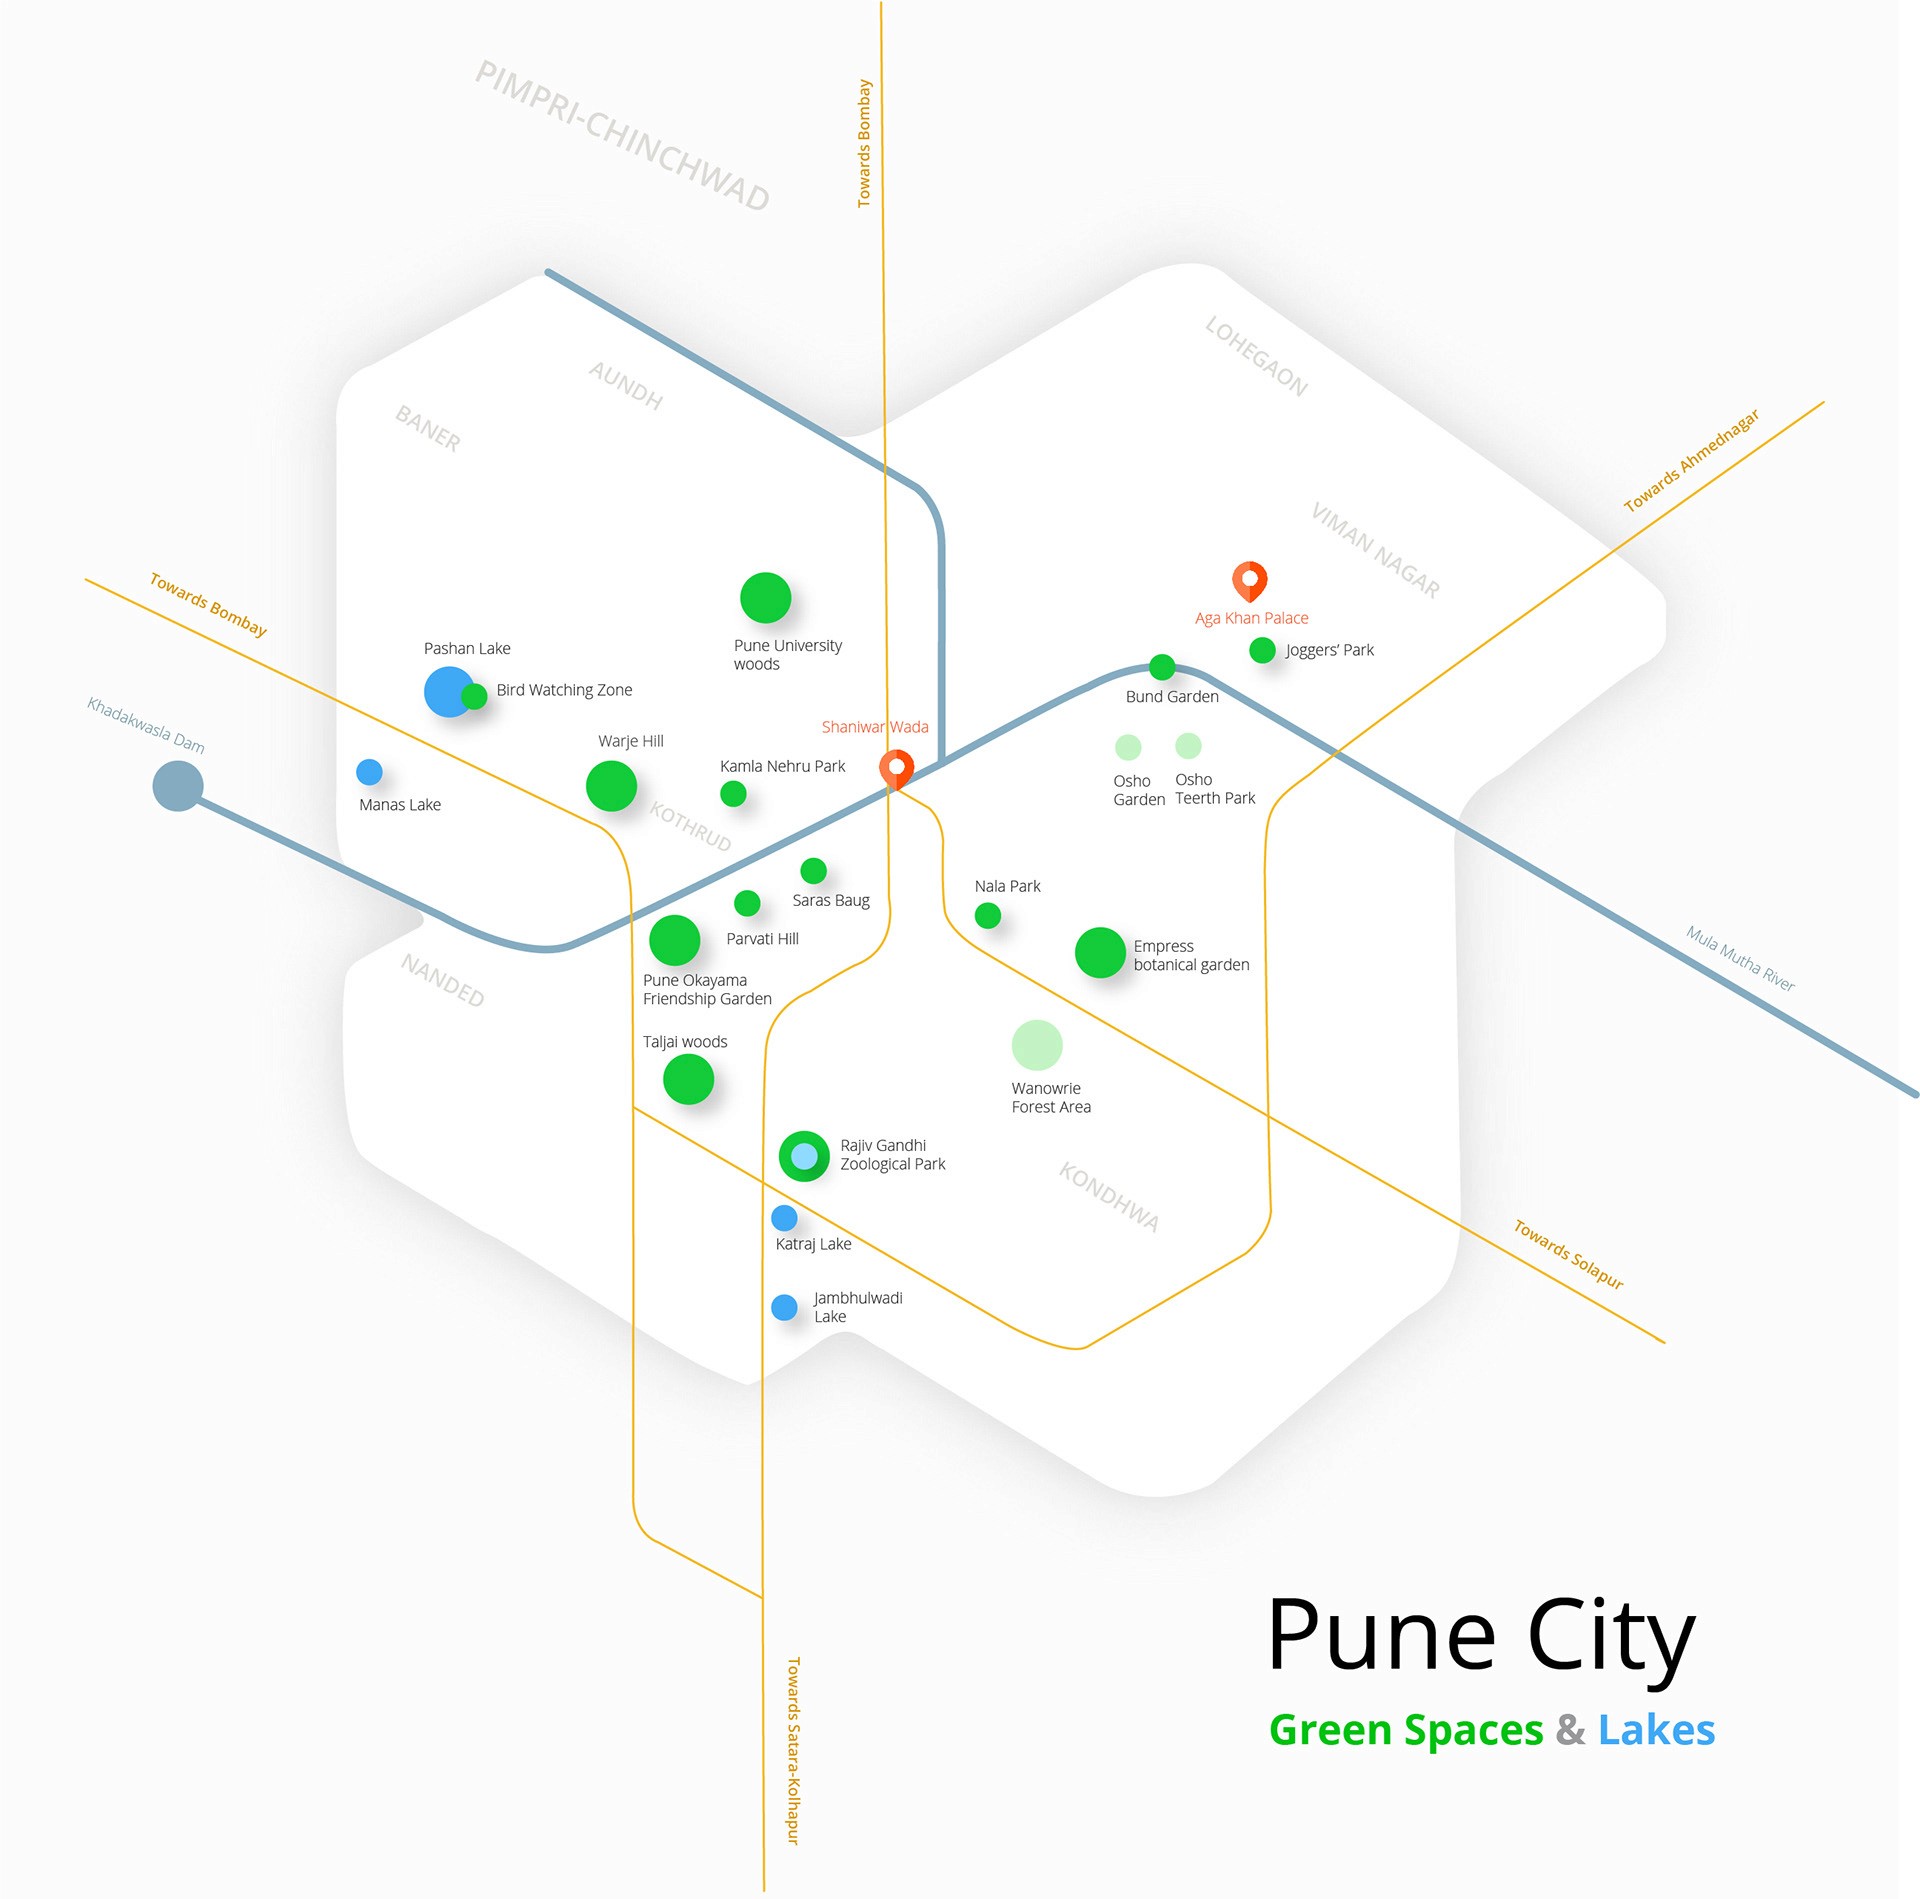
This project outlines the process of creating a schematic map. It shows the final outcome: a map that highlights green apces and water bodies in Pune for the viewer to refer to while scouting Pune.
ABOUT
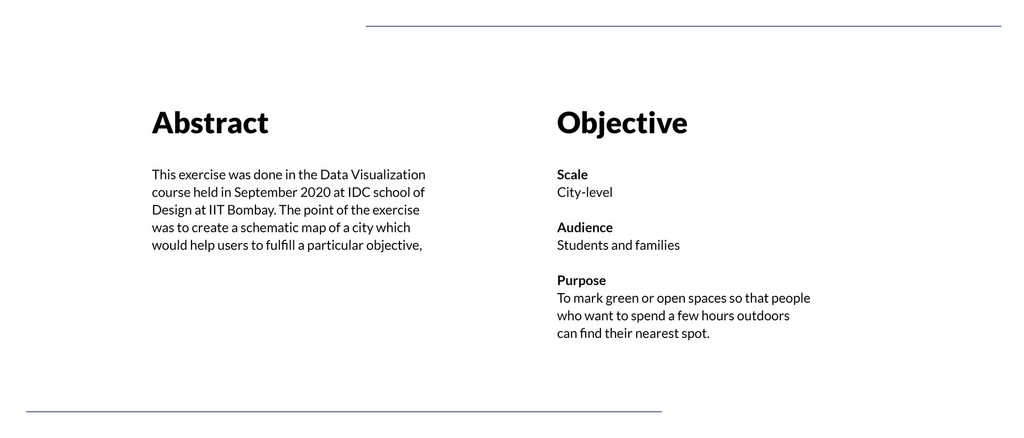
A city-level schematic designed to help people locate green and open spaces around Pune when they need a breather from the indoors.
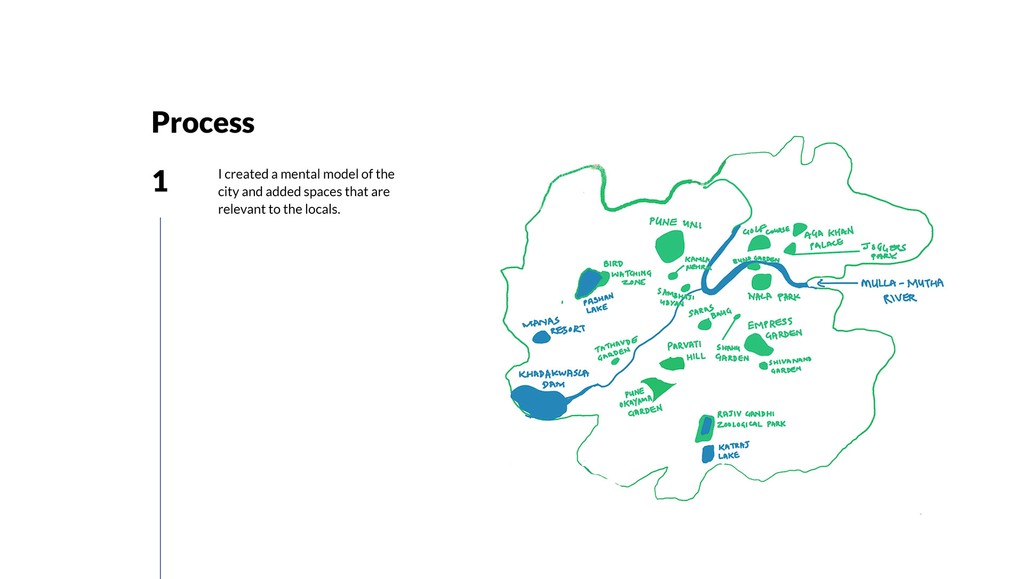
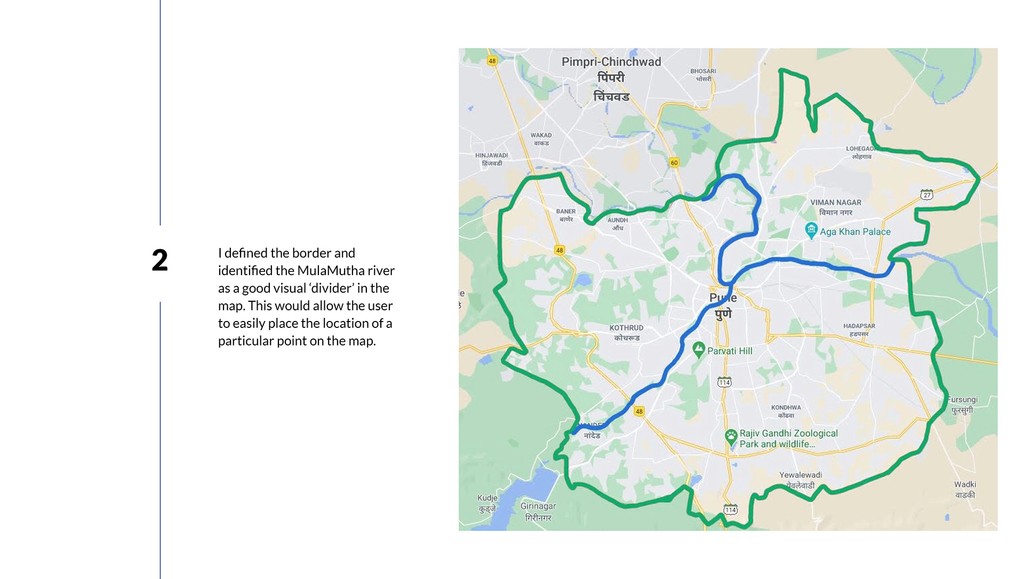
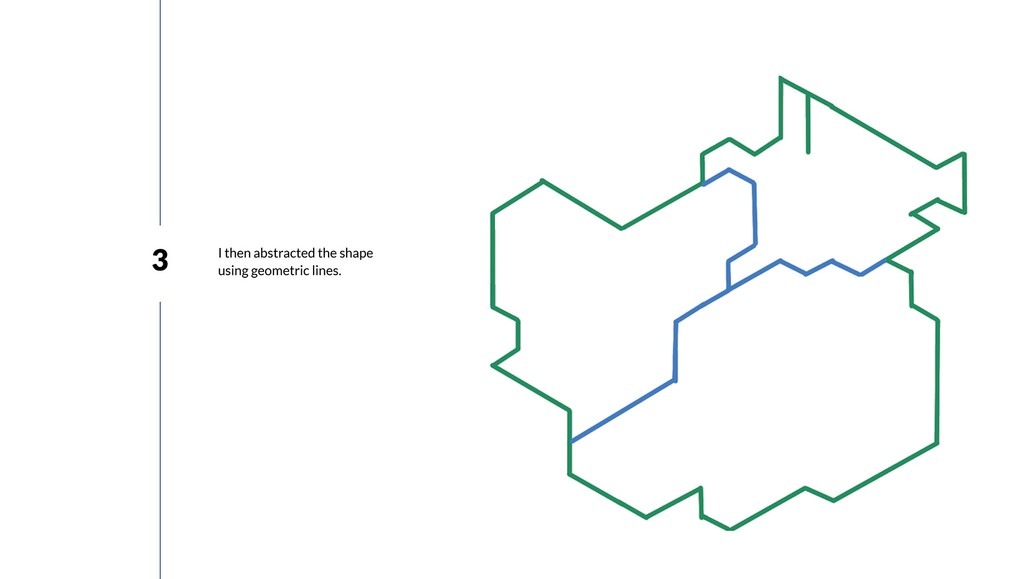
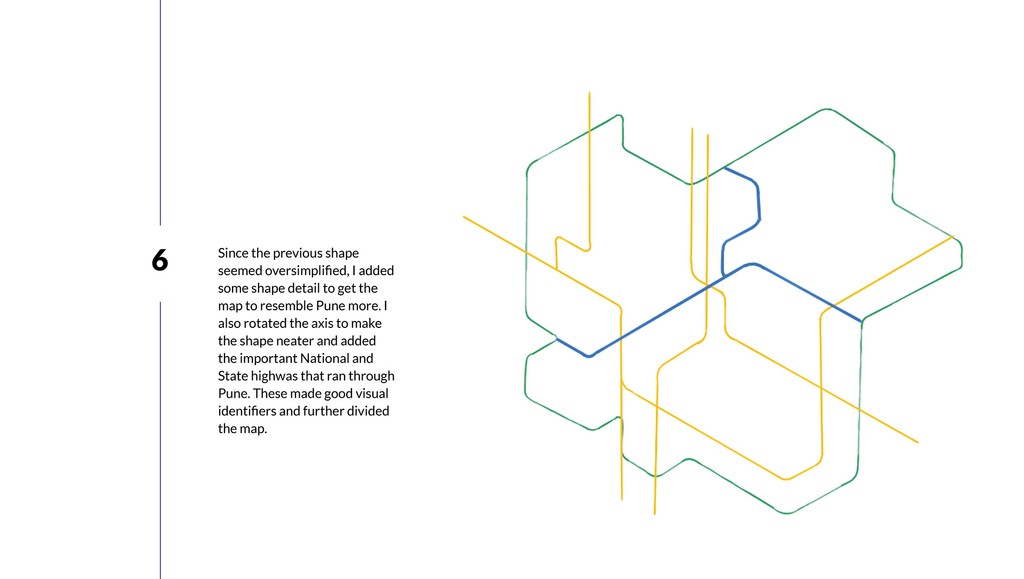
This was a data visualisation exercise from my time at IDC School of Design, where the goal was to create a schematic map that helped users complete a specific task. I chose to map Pune’s green spaces and lakes to provide an overview of the options for better decision making, rather than a transit map or navigation tool. Instead of using literal layouts or GPS-accurate designs, I focused on building a simplified mental model of the city. I picked natural landmarks like the Mula-Mutha river to act as dividers and slowly abstracted the entire city form down to its most essential geometry.
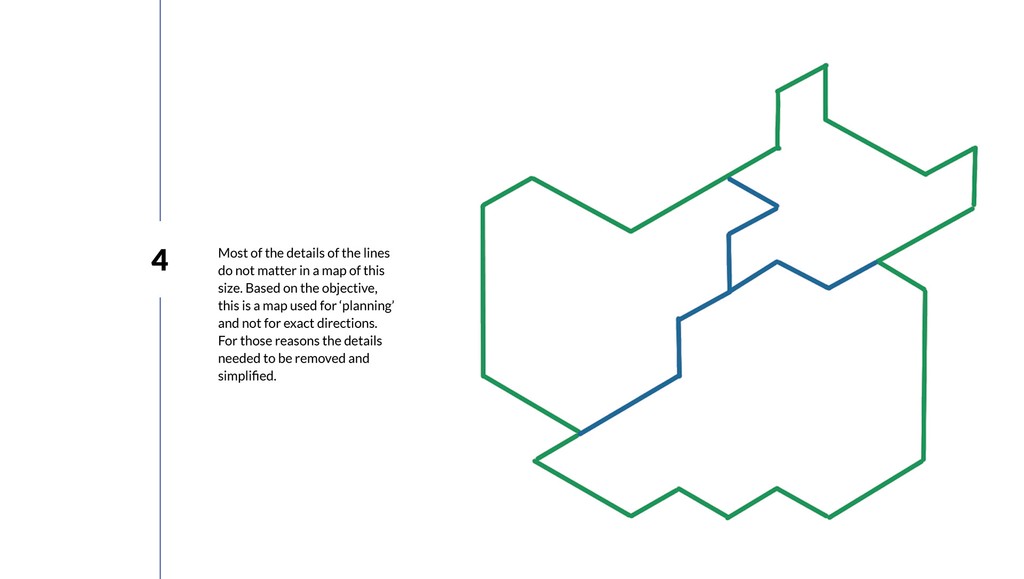
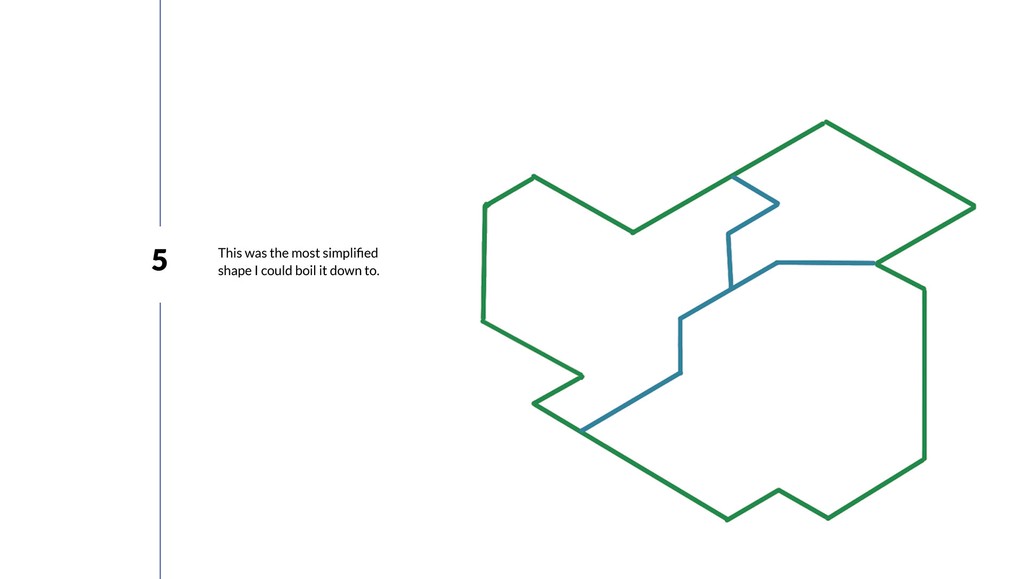
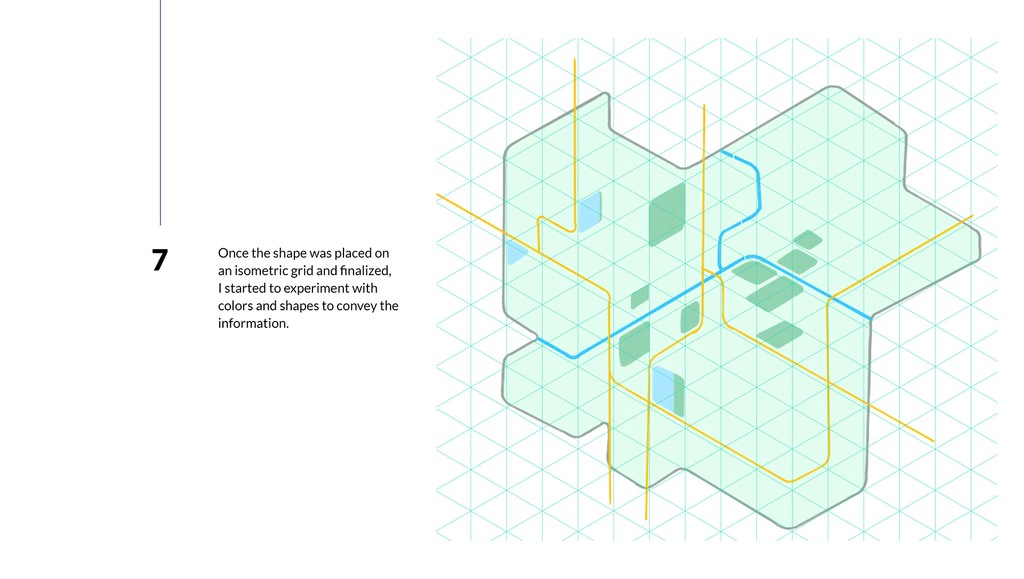
The map went through several iterations, from messy mental sketches to polished isometric grids. Each layer was stripped down to simplify the form of the map and reduce clutter. I used color, scale and spatial rhythm to guide the eye.
ABOUT
A city-level schematic designed to help people locate green and open spaces around Pune when they need a breather from the indoors.
This was a data visualisation exercise from my time at IDC School of Design, where the goal was to create a schematic map that helped users complete a specific task. I chose to map Pune’s green spaces and lakes to provide an overview of the options for better decision making, rather than a transit map or navigation tool. Instead of using literal layouts or GPS-accurate designs, I focused on building a simplified mental model of the city. I picked natural landmarks like the Mula-Mutha river to act as dividers and slowly abstracted the entire city form down to its most essential geometry.
The map went through several iterations, from messy mental sketches to polished isometric grids. Each layer was stripped down to simplify the form of the map and reduce clutter. I used color, scale and spatial rhythm to guide the eye.
PROCESS IMAGES
the final outcome
process images